Software Vertex MadnessPublished on Tue, 7 Nov 2023|4 minute read
In this post, I continue this small series on the challenges faced when writing data to a Graph database: the strategies attempted, their outcomes, and what's coming next. For the previous post in this series, see Handling Millions of Graph Writes Per Day.
Wait, what's going on?
The core problem is the following: given a bunch of computers (devices) with software installed on them (software), return a collection of devices that have software installed. For example, can we quickly and easily answer questions like these?
- In the last 30 days, which devices had Zoom updated?
- Which devices currently have Firefox in my organization?
- How many software updates were installed across all of my devices this week?
- How many devices have received software updates this week?
What kind of data are we talking about here?
organizations own devices, and each device has software (a combination of name and version) installed. In the graph, we want to express these relationships between organization, device and software.
Background Quantified
In this data set:
- There are about 1.5M total software, expressed as combinations of name and version.
- Likely, not all of these combinations are active or useful.
- Each organization has about 1k different softwares installed on its devices.
- Each device has about 200 software installed.
- There are about 50k organizations.
- There are about 800k devices.
How did you model the Device/Software relationship?
Although the relationships are very clear, there are actually several different ways one might structure them graphically. A few different solutions were tested, and in this section, we'll discuss the Pros and Cons of each.
-
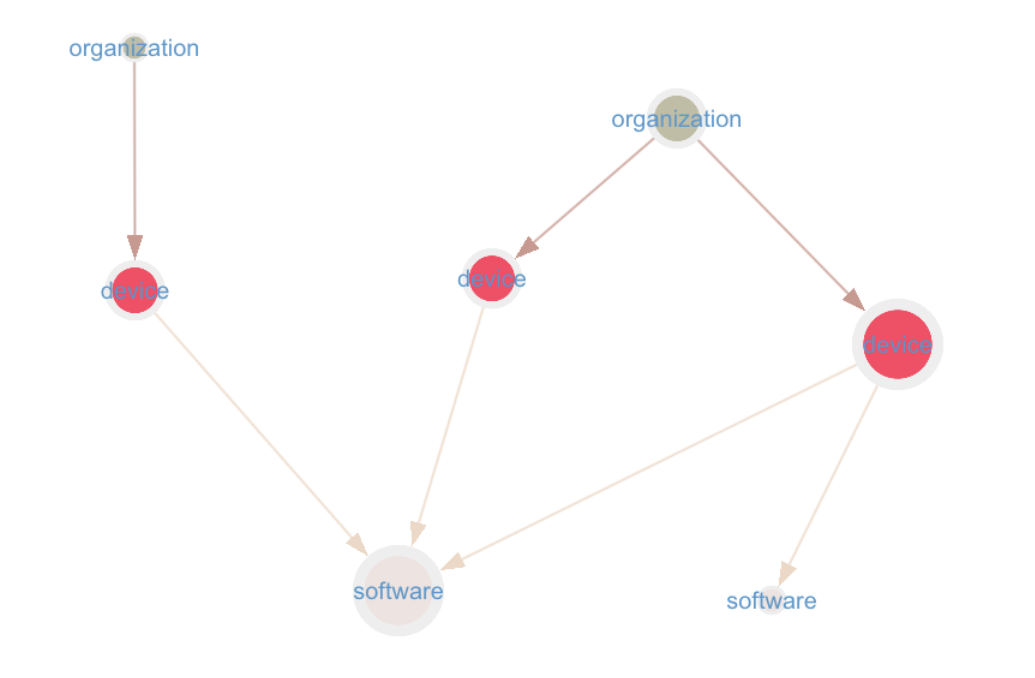
software as first-order vertices, shared between organizations and connected to devices. This would amount to ~1.5M software nodes.
-
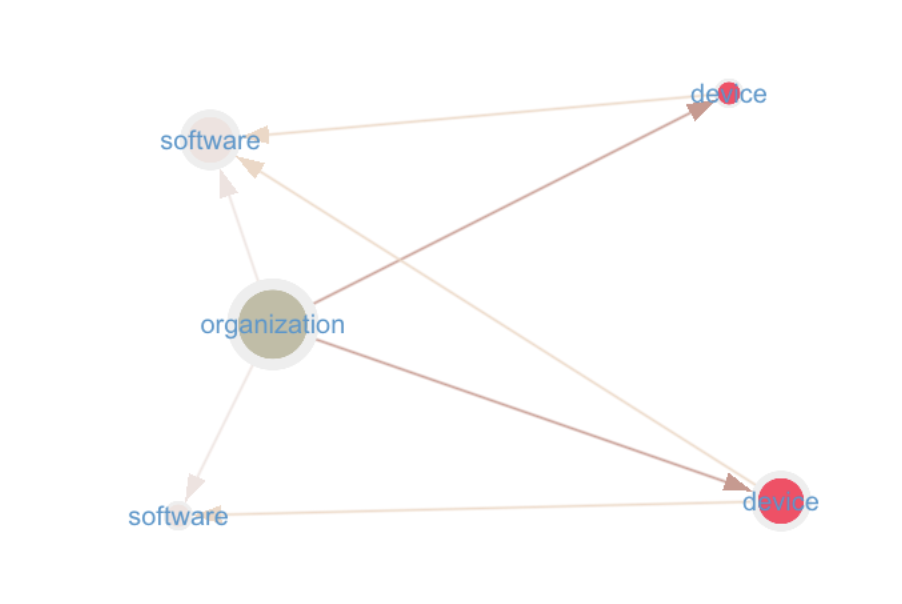
software as a vertex nested within an organization (duplicated at the organization-level). This would amount to ~50K organizations * 2k software = 100M nodes.
-
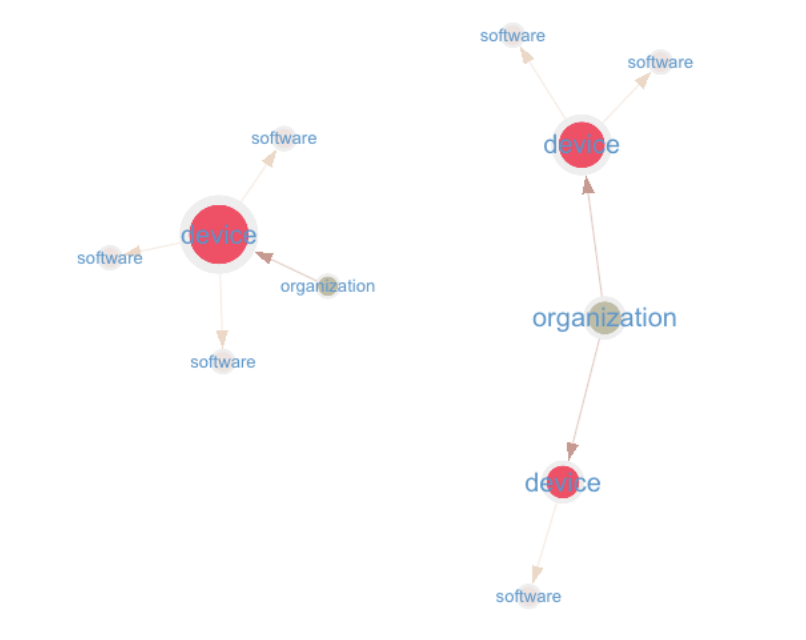
software as a vertex, within a device (duplicated at the device-level). This would amount to 800k devices * 200 software = 160M nodes.
Option 1: Software as First-Order Vertices
In this option, each software vertex is unique in the graph. They are shared among devices in every organization, as in the structure below. Note, devices have Property nodes, but that's irrelevant here.
There is only one edge, between a device and a software (label hasSoftware).

Pros
- There is a low number of total software vertices (probably lower than 1.5M, since some may no longer be actively used).
- Each new software results in only one newly created vertex.
- To add a software to a device only a single edge need be written.
Cons
- software, expressed like this, are super nodes: they will have a massive number of incoming edges (think, for example, of a common software like Firefox).
- Almost every device will have an outgoing edge to the vertex for commonly used software (like Firefox).
- Removing software vertices is also impossible; the drop query will certainly time out.
Option 2: Software Nested at the organization-level
In this option, each organization keeps a unique copy of every software installed on at least one of its devices.
Two edges maintain the relationships: 1. The edge from the organization to the software, declaring the presence of the software within the organization (label hasSoftware). This relationship is never modified. 2. The edge from the device to the software, declaring that the software is installed on the device (label hasSoftware). This relation can be added/dropped (and with either a soft or hard delete strategy).

Pros
- Better separation of software vertices(i.e. sharding) between organizations
- software vertices are presumably no longer super nodes.
- Removing a software is now easier, since each software vertex is a private copy within an organization.
- Although we're duplicating software vertices within an organization, there is still some vertex-sharing going on.
Cons
- Much higher number of vertices (~100M versus 1.5M)!
- There are more writes required. Even if another organization has a software, a new software vertex must still be written for an organization without it.
Option 3: Software at the device-level
In this option, each device keeps its own copy of every software vertex it has installed.
software vertices are therefore duplicated for each device, and a vertex is created every time a device has a software installed.
There is only one edge, from the device vertex to the software vertex (label hasSoftware).

Pros
- The graph is a Directed Acyclic Graph, which is easy to traverse, starting from an organization, down to a device, and then to its software.
- The write queries is easy to write, and the data model is the most like reality.
Cons
- This implementation results in a massive number of duplicated software nodes... and therefore a massive number of writes.
The Path Forward
Considering the Pros and Cons, which option makes the most sense? For me, there's a pretty clear winner, and I wasn't shy to emphasize this opinion in the descriptions. However, even a good design choice can be fraught with trouble. Check out the subsequent post in this series to find out more, Achieving Inadequate Graph Write Throughput.